Projects

Artifact Based Rendering
At the intersection between art, science, and computer graphics, this research project explores new techniques for designing hand-crafted VR data visualizations. Leveraging the perceptual expertise of classically-trained artists and the visual variation of the natural world, we developed a workflow for iteratively designing rich and compelling encodings for complex 3D datasets. Our Artifact-Based Rendering approach is actively being used as a means for artists to collaborate directly with scientists studying geochemistry, neurobiology, and astrophysics.
My Role
As the lead graduate student and first author on this research paper, I directed the software development of this Unity application, acting as a lead designer and principal programmer over two years. On my team, I oversaw contributions by three other primary developers, including a talented summer undergraduate mentee. I engaged in regular meetings with the users of our tool, both artists and scientists, in ongoing efforts to refine the constantly evolving design requirements of large collaborative research projects. I also directed and produced the above video.
Technology
This visualization design system was built in Unity and supports most common head-mounted displays. To facilitate large 3D VTK datasets targeted for Paraview, I built a C# wrapper for the VTK C++ library through a set of custom python scripts. We also used python to script automated mesh decimation and normal-mapping in Blender to handle high-resolution (more than 100,000 polygon) 3D scans of hand-made glyph sculptures. I also oversaw the development of several browser-based applets designed in P5js.
Publication Abstract
We introduce Artifact-Based Rendering (ABR), a framework of tools, algorithms, and processes that makes it possible to produce real, data-driven 3D scientific visualizations with a visual language derived entirely from colors, lines, textures, and forms created using traditional physical media or found in nature. A theory and process for ABR is presented to address three current needs: (i) designing better visualizations by making it possible for non-programmers to rapidly design and critique many alternative data-to-visual mappings; (ii) expanding the visual vocabulary used in scientific visualizations to depict increasingly complex multivariate data; (iii) bringing a more engaging, natural, and human-relatable handcrafted aesthetic to data visualization. New tools and algorithms to support ABR include front-end applets for constructing artifact-based colormaps, optimizing 3D scanned meshes for use in data visualization, and synthesizing textures from artifacts. These are complemented by an interactive rendering engine with custom algorithms and interfaces that demonstrate multiple new visual styles for depicting point, line, surface, and volume data. A within-the-research-team design study provides early evidence of the shift in visualization design processes that ABR is believed to enable when compared to traditional scientific visualization systems. Qualitative user feedback on applications to climate science and brain imaging support the utility of ABR for scientific discovery and public communication.

Bento Box
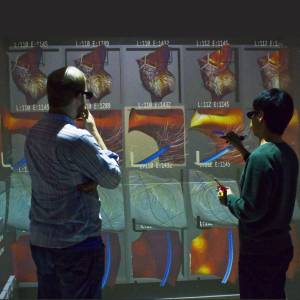
Analyzing complex 3D time-varying simulation ensembles is challenging in both the understanding of specific multi-variable data values and the comparison between different simulation instances. We developed Bento Box, a virtual reality data visualization user interface, to support these sorts of complex analysis tasks. Through Bento Box's immersive comparison grid and fluid two-handed exploration techniques, our biomedical device engineer collaborators were able to make new observations and detect errors in their advanced simulation models.
My Role
Through regular meetings with our biomedical engineer collaborators, I pioneered the design of the Bento Box interface, specifically the new 3D sub-volume comparison technique. I worked closely with a fellow grad student who focused on high-performance data streaming to develop the real-time VR CAVE application, and integrated a bi-manual interaction model programmed by our advisor. I personally oversaw the visual design of the data visualization, interviewing both our biomedical engineer users as well as a collaborating artist who provided insight into coloring and other aesthetic aspects. I also directed and produced the above video.
Technology
We built this system in C++ and OpenGL for a four-wall stereoscopic head-tracked CAVE system. We also later ported the system to the HTC Vive.
Publication Abstract
We present Bento Box, a virtual reality data visualization technique and bimanual 3D user interface for exploratory analysis of 4D data ensembles. Bento Box helps scientists and engineers make detailed comparative judgments about multiple time-varying data instances that make up a data ensemble (e.g., a group of 10 parameterized simulation runs). The approach is to present an organized set of complementary volume visualizations juxtaposed in a grid arrangement, where each column visualizes a single data instance and each row provides a new view of the volume from a different perspective and/or scale. A novel bimanual interface enables users to select a sub-volume of interest to create a new row on-the-fly, scrub through time, and quickly navigate through the resulting virtual ``bento box.'' The technique is evaluated through a real-world case study, supporting a team of medical device engineers and computational scientists using in-silico testing (supercomputer simulations) to redesign cardiac leads. The engineers confirmed hypotheses and developed new insights using a Bento Box visualization. An evaluation of the technical performance demonstrates that the proposed combination of data sampling strategies and clipped volume rendering is successful in displaying a juxtaposed visualization of fluid-structure-interaction simulation data (39 GB of raw data) at interactive VR frame rates.

Weather Report
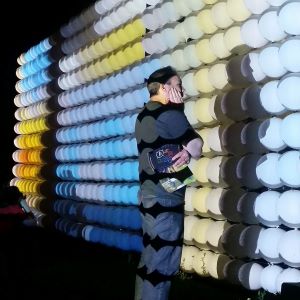
The annual Northern Spark arts festival in the Twin Cities of Minnesota attracts tens of thousands of people who gather for one night to experience art as a community until the sun rises. In 2016, artists were asked in an open call to interpret the theme of “Climate Chaos / Climate Rising” through “the creation and presentation of art in the public sphere, focusing on innovative uses of technology, old and new, to imagine new interactions between audience, artwork and place, explore expanded possibilities for civic engagement, and encourage pluralistic community.” My advisor and I partnered with seven local architects to approach this challenge by fusing our diverse design voices into a vision of a data-driven nighttime interactive sculpture with local weather data.
My Role
As our team met weekly during six months of regular design meetings, I was responsible for researching, designing, and prototyping the technological side of this evolving interactive experience. From experimenting with motors to embedding arduino-controlled LED's inside balloons, I refined our eventual idea of a "weather balloon pixel" and spec'd out the outdoor projector-based system we eventually constructed. I also designed the software framework for encoding the 60 years of local weather data that would be displayed on one of the 36-foot-long balloon walls, and the interpolation of live audience-collected subjective memory data that was projected onto the opposite balloon wall.
Technology
I built this visualization system in Processing, and accumulated the weather data using Wolfram Mathematica scripts accessing Wolfram Alpha.

Hybrid 2D/3D Sketch-Based Interfaces for Annotating Medical Data and Designing Medical Devices
Society has benefited greatly from recent advances in medical imaging and data-driven design of medical devices. However, the ability to design, analyze, interpret, and communicate about medical data remains a challenge. In this project, I performed two application case studies showing how hybrid 2D/3D sketch-based interfaces can be used to facilitate medical design and communication tasks, using an existing immersive CAVE-based 3D modeling system developed in my research lab.
My Role
I extended a C++/OpenGL CAVE VR sculpting application to accept medical images as inputs. I also worked with both medical device engineer and medical practitioner collaborators to devise real-world case studies, and directed the iterative design sessions for this project.
Publication Abstract
We explore the role that immersive technologies, specifically virtual reality (VR) and hybrid 2D/3D sketch-based interfaces and visualizations, can play in analytical reasoning for medicine. Two case studies are described: (1) immersive explanations of medical procedures, and (2) immersive design of medical devices. Both tightly integrate 2D imagery and data with 3D interfaces, models, and visualizations. This is an approach we argue is likely to be particularly useful in medicine, where analytical tasks often involve relating 2D data (e.g., medical imaging) to 3D contexts (e.g., a patient's body). User feedback and observations from our interdisciplinary team indicate the utility of the approach for the current case studies as well as some shortcomings and areas for future research. This work contributes to a broader discussion of how hybrid 2D/3D interfaces may form an essential ingredient of future immersive analytics systems across a variety of domains.